Types of Reports:
There are Four Types of Reports:
1.Tabular Reports
2.Summary Reports
3.Matrix Reports
4.Join Reports
Tabular Reports:
Tabular reports are the simplest and fastest way to look at your data. Similar to a spreadsheet, they consist simply of an ordered set of fields in columns, with each matching record listed in a row. While easy to set up, they can't be used to create groups of data and there are limits to how you can use them in dashboards. Consequently, they're often best used for tasks like generating a mailing list.
Let’s make a tabular report! In this example, we’ll want to generate a list for our Account Executive of all open opportunities above a particular amount threshold, so that she can do some outreach this afternoon.
Sales use case: Review all open opportunities above a particular amount threshold.
- On Reports, click New Report, choose the Opportunities report type, and click Create.
- Apply the following filters:
- Select All Opportunities for Show.
- Select Open for Opportunity Status.
- Select Created Date for Date Field.
- Select Current FY for Range.
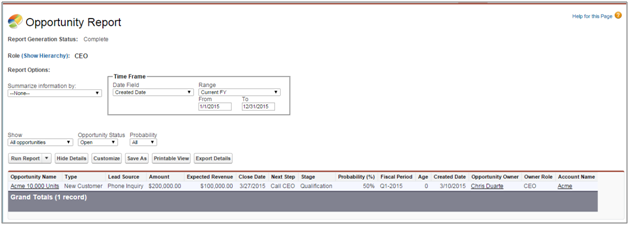
- The following columns should already be included in your report: Opportunity Name, Type, Lead Source, Amount, Expected Revenue, Close Date, Next Step, Stage, Probability (%), Fiscal Period, Age, Created Date, Opportunity Owner, Owner Role, Account Name.
- Click Save, name your report Open Opportunities This Year, and accept the auto-generated unique name.
- Enter a description and choose the My Personal Custom Reports folder.
- Click Run Report. The report should look something like this: