Summary Reports
Summary reports are similar to tabular reports, but also allow users to group rows of data, view subtotals, and create charts. These will take you a bit more time to set up, but summary reports give us many more options for organizing the data, and are great for use in dashboards. Yes!
Summary reports are the workhorses of reporting—you'll find that most of your reports tend to be of this format.
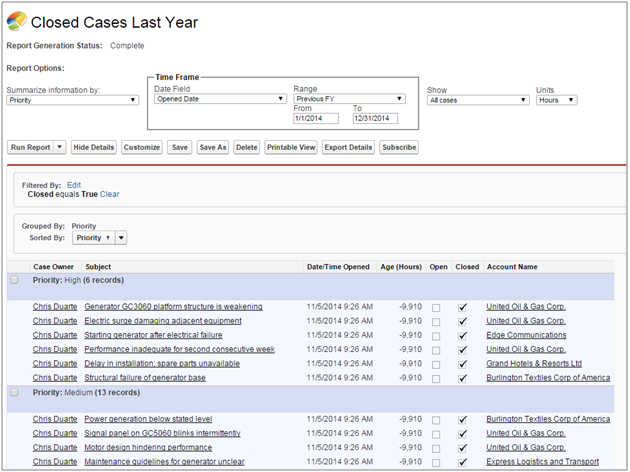
Let’s get down to it and build a summary report. In this example, our Support Manager wants to do a post-mortem on Closed cases from the past fiscal year, grouped by Priority.
- On Reports, click New Report, choose the Cases report type, and click Create.
- Apply the following filters:
- Select All Cases for Show.
- Select Date Opened for Date Field.
- Select Previous FY for Range.
- Click Add to include an additional filter for cases where Status is Closed:
- Select Closed.
- Leave the operator set to Equals.
- Click the lookup icon and select True.
- The following columns should already be included in your report: Case Owner, Subject, Date/Time Opened, Age, Open, Closed, and Account Name.
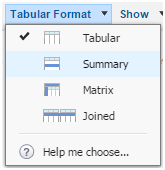
- Select Tabular, and then select Summary.
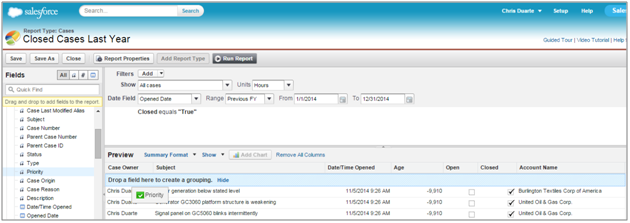
- Drag the Priority field from the Fields pane into the Preview pane, and drop it into the area labeled ‘Drop a field here to create a grouping’.
- Click Save, name your report Closed Cases Last Year, and accept the auto-generated unique name.
- Enter a description and choose the My Personal Custom Reports folder.
- Click Run Report. The report should look something like this: