Joined Reports
Joined reports let you create different views of data from multiple report types. In a joined report, data is organized in blocks. Each block acts like a “sub-report,” with its own fields, columns, sorting, and filtering. You can add a chart to a joined report.
To try this out, let’s build a simple tool to track how well sales reps are capitalizing on their opportunities. We’ll create a basic Opportunities report, add three blocks, filter each block by the appropriate status, and then group the results by sales rep.
- Create a new report with the name Pipeline Predictor, selecting Opportunities as the report type.
- Click Tabular Format and select Joined. Notice that your report data is now set off in a box with a colored border. That’s your first block.
- Create a new block by dragging the Opportunity Name field onto the preview pane somewhere to the right of the first block, and drag the Amount and Account Name fields onto the new block.
- Create a third block in the same way. Now we have three different Opportunities reports sitting next to each other in the same container. They’re all identical right now, but we’re going to use each one to tell us something unique.
- We want all the blocks to give us comparable information, so prepare each block the same way:
- Remove all the fields except Opportunity Name, Amount, and Account Name, by dragging them back over to the Fields pane. That’ll help us focus on what’s important here.
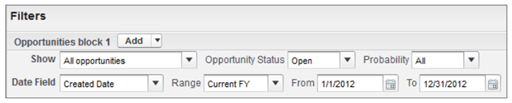
- In the filter panel, set Show to All Opportunities.
- Click the dropdown at the top right of each block and make sure Record Count is checked.
- Click the dropdown next to Amount, click Summarize this Field, and select Sum.
- Now let’s configure each block to tell a different part of the story.
- We’ll use the first block to show the opportunities that got away. Click the title (right now it just says “Opportunities block 1”), and rename it Closed Lost. In the Closed Lost filter panel above, set these filters:
- Opportunity Status equals Closed
- Date Field equals Close Date
- Range equals Current and Previous FY
- Stage equals Closed Lost
- We’ll use the second block to show the opportunities we landed. Rename the block Closed Won and set these filters:
- Opportunity Status equals Closed Won
- Date Field equals Close Date
- Range equals Current and Previous FY
- The third block will show us opportunities that are getting close to their anticipated closing. Rename the block Closing Next Month and set these filters:
- Date Field equals Close Date
- Range equals Next Month
- Opportunity Status equals Open
- Now we’ll group all three blocks by sales rep. Drag the Opportunity Owner field to the horizontal bar that says, “Drop a field here to group across report blocks.” (This is called the grouping drop zone.)
- Click Save, then Run Report.
- We’ll use the first block to show the opportunities that got away. Click the title (right now it just says “Opportunities block 1”), and rename it Closed Lost. In the Closed Lost filter panel above, set these filters: